A database that stores keys and nothing else
One constraint, followed all the way down — and the six bugs that only turned up once I stopped describing the thing and started measuring it.
There is a question that keeps coming back in different clothes. Have I already seen this? Deduplicating a message bus that redelivers. Idempotency keys on a payment endpoint. Rate-limit buckets. Blocklists. A crawler's set of fetched URLs.
Every general-purpose store can answer it, and each one charges for generality this question does not need: a value to put somewhere, a leader to elect, a merge to resolve, a scan to avoid, a JVM to tune. So I went the other way and built a store that supports exactly one data type — the key — to find out what that buys.
The short version: more than I expected, and the interesting parts were not the ones I designed.
What the constraint pays for
With no values, two concurrent writes to the same key cannot disagree about anything except whether the key exists. That collapses the hardest problem in a replicated store into a comparison of two integers:
{key, lamport, node, alive?, wall, expires_at}

def merge(a, b), do: if newer?(a, b), do: a, else: b   # total order on {lamport, node}
Commutative, associative, idempotent. Two replicas that have seen the same writes
agree, in any order, with nothing exchanged. Compare what the application has to do
elsewhere: read a vector clock and resolve siblings in Riak, reason about per-cell
timestamps and gc_grace_seconds in Cassandra, write conditional
expressions in DynamoDB. Here it does nothing, because there is nothing to lose.
The per-key metadata is four fixed fields and does not grow with the cluster or with write history — unlike a vector clock, which grows with every actor that ever touched the key.
Two more things fall out. There is no leader, so there is no election and no pause
during failover; any node coordinates any key, and losing one costs capacity rather
than availability. And because a key is its own payload, the replica-local answer is
a single :ets.lookup in the caller's own process — no mailbox, no copy,
no serialisation. That path measures 338 nanoseconds.
An unexpected detour through Plan 9
Partway in it became obvious that the data model already existed somewhere else. In Plan 9, data is a name in a namespace — and a set with no values is a directory of empty files. The mapping is not a metaphor, it is the same structure:
stat    →  member?     walking to a key fails with ENOENT when it is absent
create  →  add
remove  →  delete
So the store speaks 9P as a second frontend. Mount it, and you inspect the database
with ls, cat and stat, with no client library
at all; control files replace a pile of admin endpoints. Adding the whole thing
changed nothing in the replication core.
Plan 9's union mounts came along for free too. bind -a makes one name
resolve through several directories in order, which — for a store that holds only
keys — is exactly set union. Named sets compose at read time, copying nothing:
member_any?(["blacklist", "greylist"], key) is three concurrent quorum
reads that stop at the first true.
Where Plan 9 does not fit, it does not fit hard, and the honest thing is to say so: 9P is stateful and walk-oriented, which is the wrong shape for fanning a write out to replicas, and it has nothing to say about quorums. Nodes replicate over Erlang distribution. 9P is a client frontend and nothing more.
Bug one: the repair that repaired 80% of it
Three nodes on one machine, n=3 r=2 w=2. Kill a node, write ten keys,
bring it back, read the keys so read repair can heal it. It healed eight.
The immediate cause: read repair only fixes replicas that answered, and a quorum of two returns as soon as two of three have replied — so the third usually misses its own repair. The deeper cause was worse. The ring was built from reachable nodes, so a node that went down dropped out of the preference list entirely. Ownership moved on the way down and moved back on the way up, and in between nobody was responsible for the writes the absent node missed. There was nothing accumulating for it because, as far as the ring was concerned, it was not a replica.
The fix is the Dynamo one: build the ring from every node the cluster has ever verified, and apply reachability on top as a separate set. A key's replicas then do not move when a node blinks — it keeps its share of the keyspace, and the writes it could not take become a hint queue that drains when it returns.
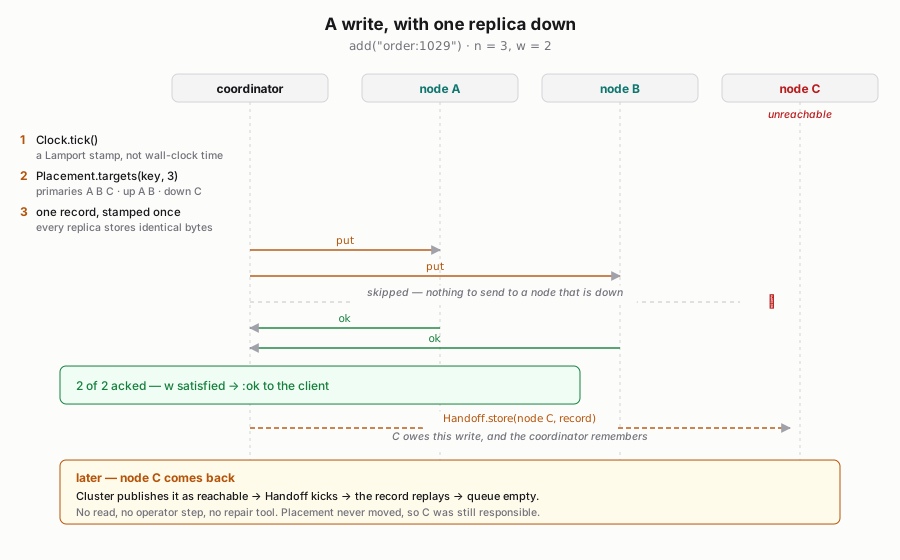
Same scenario afterwards: ten keys queued as hints while the node was away, replayed on rejoin, 30 keys on all three nodes, queue empty, and not a single read involved.
Bug two: a default argument that rebuilt the ring on every request
Writing up the performance numbers meant replacing estimates with measurements, and the first measurement found something embarrassing. A single-node write cost 51 µs, and profiling each layer put 42 of them in one place: working out which nodes own the key. That is a SHA-256 and a binary search. It should be under a microsecond.
def ring, do: :persistent_term.get(@pt_ring, empty_ring())Elixir evaluates arguments eagerly. empty_ring() builds a 128-point
consistent hash ring — 128 hashes and a sort — and it was being built on
every single request, as the default value for a key that was always
present. A lazy default:
| Operation | Before | After |
|---|---|---|
| Placement lookup | 42.19 µs | 0.32 µs |
Kurwa.add | 51.34 µs | 4.88 µs |
Kurwa.member? | 49.08 µs | 2.80 µs |
Ten times faster on the write path, from deleting one pair of parentheses' worth of eagerness. It had been there since the first commit, invisible, because nothing in the test suite cares how long a correct answer takes.
Bug three: the number I published was wrong
The HTTP gateway measured 113,000 requests per second with keep-alive and 5,900 without, so I wrote that connection reuse is worth 19×, and put it on the site.
It is worth about 4×. The 5,900 figure was taken by hand immediately after a
30,000-request run, and it was counting sockets stuck in TIME_WAIT
rather than anything about the server. Measured properly, from a script, on a fresh
node: 32,500.
This is why the benchmarks now live in the repository instead of in my shell history. Every number on the site and in the docs is produced by a script anyone can run, and a version that is slower than the one before it is treated as a broken release rather than a new baseline.
The correction is still in the docs with the old figure struck through, because a silently restated number is indistinguishable from a number nobody checked.
What a cluster test found that a unit test could not
Automating the three-node scenario turned up one more thing. A node whose BEAM was killed came back with nothing, not with what it had: the write-ahead log append was sitting in a buffer the periodic fsync had not reached yet.
Which means a replica falls behind in two different ways, and only one of them was covered:
| How it fell behind | Who knows | What fixes it |
|---|---|---|
| Unreachable when the write happened | the coordinator | hinted handoff |
| Acknowledged the write, then crashed | nobody | read repair only |
The second row is why there is now a setting that fsyncs every write for anyone who wants the window closed — and why the next thing built was active anti-entropy: a background pass that compares replicas and repairs what it finds, whether or not anybody reads the keys.
That part had a pleasant surprise in it. Anti-entropy is normally a Merkle tree, so that two replicas holding millions of keys can compare roots and descend only where they differ instead of shipping everything. With no values, the tree is not worth building. A leaf digest is a hash over a handful of fixed-size fields, and the entire vector of 4096 bucket digests is 32 KB — one message, one round trip, no descent at all. The comparison a tree exists to avoid turns out to be cheaper than the tree.
The test is the scenario that motivated it: kill a node hard so it loses eight writes it had already acknowledged, restart it, read nothing, run one repair round. All eight come back.
The numbers, and where they do not apply
On one laptop, all three nodes sharing the same CPU: a local membership check in 361 ns, a quorum across three nodes in about 40 µs, 64,600 writes and 68,600 reads per second at 64 concurrent clients, 131,000 requests per second through the HTTP gateway with keep-alive, and 128 bytes of RAM per key. How the quorum got from 52 µs to 40, and why the HTTP figure is not comparable with the earlier ones, is further down.
Figures from different days on a laptop come from different machines. Between September and October this one got slower at anything that uses every core: the September release, checked out and run again, lost 10–20%, and so did the same Redis binary with the same client, 142,600 down to 102,400. So only figures taken side by side on the same day are compared below.
That last number is the one that decides how much a machine can hold, which is why there is now a second engine. It keeps recent keys in memory and older ones in immutable sorted files, with nothing in RAM per table but a Bloom filter and a sparse index — three bytes per key rather than 128, so the same machine holds about 43 times more. The filter is what makes that work, and it pays off in the direction that matters: at first, a key that is there cost a seek at 11.8 µs, and a key that is not was answered from memory in 380 nanoseconds, faster than the in-memory engine manages. For a store whose usual answer is "no, not seen", the common case is the fast one.
Both engines answer the same behaviour contract, and the way that is checked is by running the entire test suite against each of them rather than asserting it.
One function in Rust, and what it taught
The Bloom filter is the read path of the on-disk engine, so it was the obvious thing to make fast. In Rust, a membership check on a filter that has to examine every probe went from 2 728 ns to 45 — sixty times.
The end-to-end number is the one worth quoting, and it is much smaller: an on-disk read of an absent key went from 380 ns to 280, about 26%. Once the filter stopped being slow it stopped being most of the cost. A present key barely moved at all.
A sixty-fold improvement to a function is a twenty-six percent improvement to the operation. That is not a disappointment, it is the reason to measure instead of assert — the next thing worth touching is now somewhere else.
And the next thing was not Rust at all
A present key still cost 11 µs, so I timed the pieces of that read rather than guessing at it again:
:file.pread of the block | 7.2 µs — 83% |
| decode, index search, calls | 1.4 µs — 16% |
| the Bloom filter | 0.05 µs — 1% |
The function I had just made sixty times faster was one percent of the read. What
cost everything was a one-line decision made weeks earlier: the file handle was
opened without :raw, so that any process could use it. A non-raw handle
in Erlang is a message round trip to the process that owns the file. The same 1 KB
read, measured both ways: 6.41 µs shared, 1.46 µs raw.
Raw handles belong to the process that opened them, so a table cannot keep one and hand it round — which is why I had avoided them. The fix is that a table now holds no handle at all. It is plain data, which is what belongs in shared storage anyway, and each reading process opens its own raw handle on first use and keeps it, capped so a compacted-away table cannot pin inodes forever.
| On-disk read of a key that is present | |
|---|---|
| before any of this | 11.8 µs |
| Bloom filter in Rust | 11.0 µs |
| key moved out of the encoded payload | 10.0 µs |
| raw file handles, in the benchmark | 3.6 µs |
Three times faster overall, and the part that did almost none of it was the part written in Rust. I do not regret the Rust — the filter is now genuinely free, which is why an absent key answers in 200 nanoseconds. But if I had profiled the pieces before reaching for a faster language, I would have found the 83% first, and it was a one-line change.
What is not in Rust is the more deliberate half. The rule for what may cross over is: a narrow interface, pure CPU, no I/O, no awareness of the cluster, and short enough never to hold a scheduler. That excludes almost everything here. The entire node-to-node protocol is 79 lines of Elixir, because the runtime already provides the transport, the framing, the serialisation, the timeouts and the up/down events. In Rust those 79 lines are a few thousand — and they are the part that is hard to get right. Both cluster bugs in this project were ten-line fixes precisely because the transport underneath already worked. So the split is the one Riak made with LevelDB, not the one Scylla made by rewriting Cassandra in C++.
It is optional, too: without cargo the project compiles, the Elixir
implementation is used, and a test checks that the two agree on six thousand probes.
A filter that disagrees with itself is a filter that says no to a key it holds.
Bug four: the benchmark ran in the wrong process
That 3.6 µs was true, and it was not what a request paid. Measuring the on-disk engine over HTTP for the first time — a million keys loaded, eight tables on disk, a key from the first batch — it answered 47,800 requests a second against 104,000 for the in-memory engine. A 3.6 µs read cannot halve anything at that rate.
A raw handle belongs to the process that opened it, so the fix had cached one per
process. The benchmark reads from a single process, opened each file once, and never
saw the cost again. A real read never runs in a process that lives: the quorum gives
every replica call a fresh worker so that late replies die with it, and a call from
another node arrives through :erpc, which spawns one too. So every read
opened the file, read one block, and closed it as the worker exited.
| On-disk read of a key that is present | |
|---|---|
| 0.7.0, a shared handle | 11.0 µs |
| 0.8.0, from the benchmark's one process | 2.55 µs |
| 0.8.0, from a fresh process — what a request did | 28.7 µs |
| 0.8.1, a pool of readers that own the handles | 3.4 µs |
The release that was three times faster in the benchmark was two and a half times
slower in use. The fix is a reader per scheduler that opens each table once and keeps
it: a read sends it the path and the range, and gets the block back as a
reference-counted binary, so nothing is copied. One message each way instead of an
open and a close.
This is the second bug in this article that no test could have found, because the answer was right every time. The lesson is narrower than "measure": measure the path a request takes, from the process it takes it in. The benchmark now does.
Measured against Redis, on the same machine
Redis's own guide is blunt that comparing one benchmark tool's output to another's and extrapolating is pointless. It is right, so I did not do that: I built Redis 8.0.3 here and ran both servers on this laptop, one at a time, asked the same question by a client with the same concurrency. Then I did it twice more, and the second time I found the clients had been the ceiling all along — so these figures are from the third: four client threads on each side, a million requests, three runs each.
A million 13-byte members:
| Bytes of RAM per key | |
|---|---|
redis SET, hashtable encoding | 30.2 B |
| kurwadb, in-memory engine | 128.1 B |
| kurwadb, on-disk engine | 3.0 B |
| a Bloom filter on its own | 1.2 B |
Membership over the wire, one node, no replication on either side:
redis SISMEMBER (RESP) | 142 800 /sec |
kurwadb GET /k/:key (HTTP + JSON) | 118 900 /sec |
| kurwadb, same question across a 3-node quorum | 68 600 /sec |
An earlier version of this article guessed that Redis and the in-memory engine were in the same league on memory. They are not: Redis is four times better. Some of that gap is what we store — a kurwadb record carries a Lamport stamp, the node that issued it, a tombstone flag, a wall clock and an expiry, about 40 bytes of content against Redis's 13, because those five fields are what make it replicate and expire. The rest is BEAM term overhead.
The interesting direction is the other one. The on-disk engine uses ten times less memory than Redis, and that is not a language question at all: what is in RAM is a Bloom filter rather than the keys.
Redis is about 20% faster on throughput. For one day this article
said it was a tie — 102,400 against 103,300, inside 2% on every run — and I read
that as both servers having outgrown their storage. It was both clients
having hit theirs. ab is one thread, and so is
redis-benchmark unless told otherwise. Against the same kurwadb node at
the same 64 connections, one ab read 96,900 requests a second and four of
them, summed, 133,900. Given four client threads each, Redis pulls ahead again.
I put that remaining gap down to HTTP and JSON against a binary protocol, and wrote
that closing it was a protocol question. So kurwadb learned RESP, and the same
redis-benchmark drove both servers: one request at a time, Redis still
answers 15–20% more, and kurwadb answers RESP exactly as fast as it answers HTTP.
The protocol was never the gap. It is the cost of a request inside the server — a
process per connection, a placement lookup, a quorum of one — and pipelined, where
Redis's single thread over one dictionary is at its best, it leads by 2.2 times.
That is a real result about Redis, not a flaw in the measurement, and it belongs
in the same table as the memory figure that goes the other way.
The site used to list the on-disk engine at "115–123k" over HTTP as well. The script never measured that: it writes a single key into whichever engine is the default, so the figure was the in-memory one copied across. Measuring it properly is what found bug four. With a million keys and the one asked for on disk:
GET /k/:key, 1M keys, 64 clients | In-memory | On-disk |
|---|---|---|
| key present | ~122 000 /sec | 92 000 /sec |
| key absent | ~117 000 /sec | 116 000 /sec |
A hit from disk costs a quarter of the throughput; a miss costs nothing, because the filter answers it without touching the file. The data set sits in the OS page cache here, so "from disk" means a syscall answered from memory — the steady state for a set that fits in page cache, and the best case for one that does not.
Where a quorum read went
With the clients out of the way, the next number to take apart was the cluster: a read across three nodes cost 52 µs. Timed in pieces, from inside one of the nodes:
the whole read, n=3 r=2 | 52.5 µs |
| a bare message to another node and back | 29.9 µs |
:erpc.call to another node, doing nothing | 40.3 µs |
| the quorum's own processes, no work in them | 4.4 µs |
Thirty microseconds is one round trip through the kernel's TCP stack on loopback, and
no code of mine shortens it; on separate machines it becomes the network. The rest
was mine. :erpc spawns a process on the far node for every call, which
was ten microseconds on top of the round trip, and the quorum started a collector and
then a worker per replica just to wait for each answer.
So a read or write now goes as a plain message to one of sixteen long-lived processes
on each replica, and the collector sends them itself — sending does not block, so the
workers had nothing to do. The first version was slower than before, 56 µs,
because I had put a monitor on each remote process so that a dead node would fail the
request at once. Monitoring a process on another node is two more signals over the
wire. monitor_node gets the same answer from the local distribution
layer without sending anything, and costs about a microsecond.
3 nodes, n=3 r=2 w=2 | Before | After |
|---|---|---|
| a read, one client | 50.9 µs | 40.8 µs |
| writes, 64 clients | 46 200 /sec | 64 600 /sec |
| reads, 64 clients | 48 000 /sec | 68 600 /sec |
Bug five: an ok that did nothing
Making the quorum faster made one cluster test fail more often — the test that rewinds a replica to a newer delete underneath the cluster, reads to repair it, then adds the key back and expects to see it. It had been flaky for days on the on-disk engine, and I had filed it under timing. It was a bug.
A write is stamped by the clock of the node that coordinates it. The repair that the
read triggered goes out asynchronously from a different node, so the add that
followed could be stamped by a coordinator that had not heard of the delete yet — with
a lower stamp. Every replica then kept the delete, as last-writer-wins says it should,
and every replica answered ok with the version it kept. The coordinator
counted those as acknowledgements. The client was told the key was added; it was
not.
The fix is to read the answers. A replica already returns the winner of its merge; if that is not the record the coordinator sent, the coordinator raises its clock past it and writes once more, with the stamp it would have used had it known. On the common path every winner is the record just sent, and it costs nothing. A test now builds that state on purpose and failed until the change; the flaky one has passed twenty runs in a row since.
It took a performance change to expose a correctness bug, which is the argument for not leaving a flaky test flaky. "Fails one run in three" was the only symptom of a write that could be acknowledged and lost.
Seven protocols, one path
Plan 9 turned out to be the first of several. kurwadb now also answers the
PostgreSQL, MySQL, Redis, MongoDB and SQL Server wire protocols, so psql,
mysql, redis-cli, mongosh, sqlcmd
and the drivers people already have connect to it as they are. With HTTP, that sounds
like seven products. It is one, and the reason is worth showing, because
it is the same reason 9P cost nothing: the store underneath was never told what a
protocol is.
Follow one query. A Python program, through psycopg, asks
SELECT key FROM seen WHERE key = $1 with 'order:1':
psycopg              Parse, Bind, Execute, Sync - PostgreSQL protocol 3.0
  │
Kurwa.Pg.Server      one process per connection; bytes into messages
  │
Kurwa.Sql            text → tokens → {:select, from: "seen", where: key = $1}
  │                  → Namespace.member?("seen", "order:1")
  │  ── below here, nothing knows which protocol asked ──
Coordinator          storage key <<4, "seen", "order:1">>; ring → replicas A, B, C
Quorum               the local replica inline, the others by message; wait for r = 2
Store                ETS lookup - or memtable, Bloom filter, one pread of a block
  │
Record               {key, lamport, node, alive?, wall, expires_at}, merged by
  │                  last-writer-wins; a replica that lagged is repaired
Exec                 true → one row, ["order:1"]; false → no rows
Kurwa.Pg             RowDescription, DataRow, "SELECT 1" - one write to the socket
Three different things get parsed, by three different layers. The wire is
the frontend's: framing, parameter types, text or binary formats, authentication —
all of it protocol-specific, none of it about keys. The meaning is the SQL
layer's, and it is shared: MySQL arrives through a different codec and a different
lexer dialect — backticks, ? parameters — and leaves through the same
parser and executor as one call, member?. And the data is the
core's, which receives that same call whether it came from HTTP, a 9P
stat, a SQL SELECT, a Redis SISMEMBER or a
MongoDB find.
As for "the value it returns": there is none to return. A record holds a key, a
Lamport stamp, the node that issued it, whether it is alive, a wall clock and an
expiry — and nothing a caller wrote other than the key. So the answer to a query is
the key itself, or no row; and the only other thing a table can be asked for is
ttl, which is derived from the expiry. That is not a limitation of the
frontends, it is the constraint this article started with, showing up at the far
end of the pipe.
What each protocol cost was almost entirely its own conversation, not the data.
PostgreSQL needed enough of pg_catalog for \dt to list
sets, SCRAM, and TLS with channel binding. MySQL needed the system variables its
client asks for before you have typed anything, and columns named by their source
text, because dictionary cursors look them up that way. Redis needed nothing it
did not already have, except honesty about GET, which is an error,
because there is no value to get. The one change that went into the core for any of
them was add_new, the conditional add behind SET NX,
INSERT IGNORE and ON CONFLICT DO NOTHING — and that one was
a guarantee the store should have offered anyway.
And then MongoDB
The same shape predicted what MongoDB would take, so I wrote the prediction down
and then built it: a frontend for OP_MSG and BSON, and a table of commands mapped
onto calls the core already answers. A collection is a set; a document is
{_id: key}. A string _id is the key itself, so the
collection seen is the same set SQL calls a table and Redis calls a
set.
| MongoDB | kurwadb |
|---|---|
find({_id: "a"}), {_id: {$in: […]}} | a membership check per key, returned as a cursor that needs no getMore |
insertOne({_id: "a"}) | add_new — and a second insert gets MongoDB's own E11000 duplicate key |
updateOne({_id}, {$setOnInsert: {}}, {upsert: true}) | the same, spelled the way MongoDB users dedup |
deleteOne({_id: "a"}) | n: 1, or n: 0 if it was not there |
countDocuments({_id: …}) | the members among those — the driver sends it as an aggregation |
find({}), a filter on anything but _id | refused: it would be a scan |
a document with fields other than _id | refused: there are no values to keep |
An _id that is not a string — an ObjectId, a number — is stored under
a key made from its BSON bytes. It never has to be turned back into a value,
because nothing here lists keys: every answer is about an _id the
client named, so the reply is the value it sent.
Two things fit better than expected. MongoDB already treats a duplicate
_id as an error, so the single-winner insert that SQL and Redis needed
as an extension is simply MongoDB's ordinary semantics. And the cluster had a
ready-made disguise: every node answers hello the way a
mongos router does. PyMongo, given three kurwadb nodes, reports the
topology as Sharded and each node as a Mongos; it wrote 200 keys,
I killed one node, and the next 200 writes all succeeded, a repeated
_id was still refused, and the first 200 were all there. That is the
literal truth of a leaderless store — any node takes any request — and it needed no
pretend primary.
The cost was the conversation, as predicted: hello over the legacy
OP_QUERY that drivers still use for their first message, buildInfo,
sessions on every command, the questions mongosh asks at startup,
SCRAM-SHA-256 over saslStart — the PostgreSQL frontend's own SCRAM, in
different envelopes. Nothing below the frontend changed. The official Node.js
driver tops out at about 77,000 lookups a second against one node, and that is the
driver's ceiling on a shared laptop rather than the server's: decoding the message,
running the command and encoding the reply costs the server 5.7 µs, of which the
lookup is 0.9.
And SQL Server, where the conversation is mostly TLS
Microsoft's protocol, TDS, carried the same SQL as PostgreSQL and MySQL with a third
dialect in the lexer — [brackets], @named parameters,
TOP, OUTPUT inserted.[key], and T-SQL's habit of running
statements together without semicolons. Its idempotent insert,
IF NOT EXISTS (SELECT … WHERE [key] = @k) INSERT …, is recognised whole
and becomes add_new, so two racing batches still produce one row.
What took the time was encryption. Current SQL Server drivers encrypt by default, and
TDS 7 does it inside its own framing: the TLS handshake travels as the payload of
PRELOGIN packets, both ways, and only afterwards do TLS records go over the socket
bare. Erlang's :ssl accepts any transport that looks like
gen_tcp, so the fix was a small process standing between the socket and
:ssl that wraps what goes out and tells the two kinds of incoming bytes
apart by their first one — 0x12 for a PRELOGIN packet, 0x14 to 0x17 for a TLS record.
A client that turns encryption off still sends its login encrypted and then carries
on in the clear, so the same process also has to hand the socket back mid-connection
without a single byte of TLS reaching the client after it.
And a server with no certificate configured has to make one, as SQL Server does. The
first, from Erlang's own test helper, was rejected by Go's x509 parser — and so by
sqlcmd — because its RSA key identifier left out a NULL that the standard
says is there; the next was rejected by macOS for lacking the extensions a TLS
certificate must have. The third is built field by field and works.
Stored procedures raised the same question as everything else in this store, in a
new place: a procedure's definition is a value. Rather than keep values to support
CREATE PROCEDURE, procedures are .sql files deployed with
each node and read at start, with a hash of them in /info so nodes that
disagree are visible. A small interpreter runs a T-SQL subset — variables, IF,
EXEC with OUTPUT, THROW — and inside it, IF NOT EXISTS … INSERT is still
the one-winner add, where in SQL Server the same text races.
sqlcmd, pymssql and tedious run their checks against it, encrypted and
not, with sp_executesql and prepared statements. TLS is the expensive
part on the server too: 48,000 lookups a second through tedious with encryption,
80,000 without, against about 11 µs of everything else per request.
And the GUIs, which want a whole server
Drivers ask a few questions and then send your queries. GUIs are another animal.
DBeaver builds its navigator from fragments - SELECT n.oid,n.*,d.description
FROM pg_catalog.pg_namespace n LEFT OUTER JOIN pg_catalog.pg_description d ON
... - and a schema here, a table there, joined and filtered as the click
needs. Recognising those one string at a time does not keep up, so the PostgreSQL
frontend got a small evaluator instead: modelled pg_namespace,
pg_class, pg_attribute, pg_type and friends,
alias.* expansion, joins on their ON equalities, a
WHERE that lets a row through unless a condition it understands says
no. With CREATE SCHEMA mapped to dotted set names, DBeaver lists
schemas, tables and the one column, and pgjdbc's own metadata calls agree.
SQL Server Management Studio is further out still. It runs SMO, which sends dozens
of generated batches - temporary tables filled from xp_msver, registry
reads, CROSS APPLY, dynamic SQL - and reads every column by type. An
interpreter for that is most of SQL Server. So instead of interpreting, I recorded:
a 150-line proxy sat between SSMS and a real SQL Server, turned encryption off in
PRELOGIN both ways, and wrote down every request and every reply. A decoder turned
the replies into templates keyed by the request's normalised text, with the exact
column types the server sent; kurwadb replays them, with its own databases, schemas
and sets in the rows that are about what it holds. A replay harness sends the
recorded session to kurwadb and compares every column type: 60 of 60. SMO chooses
its queries by version, so kurwadb now claims the recorded server's version - claim
another and SSMS asks questions no recording has.
Bug six: the dashboard that made it slower
A dashboard needs numbers, so 0.17.0 put counters on every request: its frontend, the coordinator, the replica layer, the shard. The project's rule is that a release slower than the one before is broken, so it was measured against 0.16.0 the same day, in turns. It was broken:
Three atomic adds do not cost 20%. What did, in order of embarrassment:
- An exception per request. Counting a request against its client
connection did
:ets.update_counteron a row that only registered connections have, and rescued theArgumentErrorfor everyone else. Every HTTP request is everyone else. 167 µs, until it asked the process dictionary first. - One hot row. "Replica requests sent to node B" was one ETS counter
that all 64 concurrent requests on a node wrote. They queued on it. Peers got slots
in a
:countersarray instead. :binary.match/2with a list compiles it every call. A cheap pre-check meant to spare ordinary queries a regex built an eleven-pattern search automaton on every PostgreSQL query: 13 µs, against 2.2 µs for parsing the whole query. That was the pgbench number.- Regex literals have been recompiled on every use since OTP 28. A
compiled regex can no longer live in a module's literals, so
~ron a request path is 300 ns of compile before every match. The ones on request paths now compile once into:persistent_term.
Fixing those got back to even. Getting ahead came from somewhere else:
Application.get_env/3 costs about 45 ns, and a read called it five or
six times - quorum sizes, timeout, engine, cache switch. Settings now live in
:persistent_term, and a membership check that took 905 ns takes 787. The
counters were paid for by a cost that had been there since 0.1.0 and nobody had
measured, which is the usual way.
Asking fewer replicas
The next idea was a smart client: compute the ring in the client, send each key straight to a node that holds it, and the coordinator answers its own copy without a hop. JavaScript and Go clients that rebuild the ring bit for bit - checked against 927 placements the server's own ring wrote out - took an afternoon. Then they were measured, and they were not faster. Not by a microsecond, on three nodes or five.
The reason was in the server. A read with r=2 asked all three replicas
and kept the first two answers. Landing on a replica turned three network requests
into two, and a quorum read waits for one remote reply either way, so the latency was
identical and the saved message was a third of the traffic - too little to see. But
the extra answers bought nothing at all: any two replicas overlap every write's two,
because r + w > n. So 0.18.0 asks r - itself first when it holds a
copy - and the others only if those take longer than 10 ms, so a stalled replica
costs a read the hedge rather than the two-second timeout:
Reads across three nodes under 64 clients, measured both ways on the same day: +54%, one read alone 39.7 to 36.7 µs, writes unchanged because they still go everywhere, as they must. And now the clients' routing means something: on five nodes, reads go from 44,500 a second to 55,400 with both. The lesson is the one from the ring bug, from the other side: the client was right, and measured, and useless, because the cost it was saving was not the cost there was.
Where this should beat what people use today
Losing to Redis by 10–20% on one node is not a reason to use anything, and neither would a tie be. The reasons are architectural, and each one is a consequence of storing no values rather than of the code being clever. Only Redis has been measured against here; the comparisons to other systems are about what their designs make them do, not benchmarks.
- A set larger than RAM, answered exactly. Open-source Redis keeps every member in memory at 30 bytes each. The on-disk engine keeps 3: a billion keys is roughly 3 GB of RAM against 30. Until 0.8.1 the price of that was an 11 µs read for any key that was present — 28.7 in 0.8.0 — and it is 3.4 µs now. Over HTTP that is 75% of the in-memory engine's rate on a hit and all of it on a miss, and a miss is the usual answer to "have I seen this?"
- Exact where a filter guesses. A Bloom filter, including RedisBloom, answers "probably" and cannot forget a key. This answers yes or no, deletes, and expires keys on their own. It costs 3.0 bytes per key against the filter's 1.2 — 2.5 times the memory to stop being wrong, and to be able to delete.
- An acknowledged write survives losing a node. Redis replicates
asynchronously, and its own cluster documentation says a failover can lose writes
that were already acknowledged. Here
w=2of three means a write is on two machines before the client hears "ok", and anti-entropy repairs the replica that acknowledged and then crashed. - No failover window. There is no primary to fail over from. Any node coordinates any key, a dead node costs capacity rather than availability, and nothing waits out a timeout to elect a replacement.
- Conflicts that cannot happen. With values gone, two replicas can only disagree about whether a key exists, and the merge is a comparison of two integers. There are no siblings to resolve as in Riak, no conditional writes to compose as in DynamoDB, no per-cell timestamps to reason about as in Cassandra — and repair is one 32 KB message instead of a Merkle tree walk.
The pattern is the one the whole project keeps finding: the cost of generality is paid in places a key-only store simply does not have. The read path was the missing piece: "it fits on disk" used to mean "it is three times slower when the answer is yes". Now it means ten times the keys per gigabyte for a quarter of the throughput on a hit and none on a miss — which, for a store whose usual answer is no, is the trade you want.
So, plainly, when not to use this:
- One node, and the set fits in RAM. Redis is simpler, has a decade in production and an ecosystem, is 10–20% faster one request at a time and 1.5–2× as fast pipelined, and uses four times less memory than the in-memory engine. Take it.
- False positives are acceptable and you never delete. A Bloom filter costs 1.2 bytes per key against the on-disk engine's 3.0 — less of a gap than it used to be, but still a real one.
- You need scans, listings or queries. There are none, deliberately, and that will not change.
- You need the on-disk engine to be mature. It exists, and passes the same suite as the in-memory one, but it is younger and its compaction is crude.
- Zero hours in production. One author, two young client libraries, no TLS between nodes.
The actual lesson
Almost nothing in this is new. Consistent hashing with hinted handoff is Dynamo,
2007. LWW-Set is textbook CRDT. Quorums with r + w > n are from the
same paper. Directories as namespaces is Plan 9 in the eighties.
What was worth doing was taking one constraint seriously enough to follow it all the way down and see what fell out. Remove values, and the merge function disappears. Remove the merge function, and the leader has nothing left to serialise. Remove the leader, and a membership check is one lookup in your own process. Then the thing turns out to mount as a filesystem, set union turns out to be free, and six wire protocols turn out to be six thin adapters over one call.
And then you measure it, and discover the ring was being rebuilt on every request - and, a dozen releases later, that a read was asking a replica it never needed.
kurwadb is MIT-licensed, 397 tests — run against both engines — plus 21 against three real distributed nodes, and about as production-ready as that sentence implies.
Source · The case for the design · Architecture, including what is deliberately missing · kurwadb.dev